

I'm a data professional who turns complexity into clarity designing end-to-end solutions that take data from raw and fragmented to trusted and decision-ready.
Over time, I’ve built experience across data engineering, business intelligence, and analytics, helping organizations transform raw, fragmented data into meaningful, actionable insights. I’ve designed and delivered end-to-end data solutions, from gathering business requirements and integrating diverse data sources to building automated pipelines and developing intuitive, interactive dashboards that simplify complex information.
My focus is not just on building data systems, but on ensuring they are scalable, efficient, and aligned with business goals. Working closely with cross-functional stakeholders, I’ve learned how to bridge the gap between technical execution and business strategy, ensuring data doesn’t just tell a story, it drives measurable impact. My work includes streamlining complex data ecosystems and developing centralized analytical platforms that improve efficiency and decision-making.
I’m particularly interested in how automation, analytics, and design thinking can come together to solve real-world problems and create data solutions that are both powerful and user friendly. If you’re looking for someone who combines technical expertise with strong collaboration and a focus on impact, I’d love to connect.
About my skills
At Mark's, a Canadian Tire Corporation company, I work as a Data Analyst building interactive Power BI dashboards and reports that help business teams make data-driven decisions. I work closely with stakeholders to understand their data needs and design visual solutions around their goals. I build data models and transform data from multiple sources to keep insights accurate. I analyze large datasets to surface trends, troubleshoot data quality issues, and optimize report performance. I also take part in the team's migration from an on-premises legacy system to Azure Synapse, covering data mapping, validation and reconciliation. I perform User Acceptance Testing (UAT), validating data accuracy and documenting results to support production deployments.
At Sanjel Energy Services, I work as a Business Intelligence and System Data Developer, responsible for designing, developing, and maintaining data solutions that supported critical business operations. I develop dashboards and reports to transform raw data into actionable insights, optimized ETL processes, and built scalable data models following best practices. I collaborate closely with business stakeholders to gather requirements, translate them into technical solutions, and ensure the accuracy, usability, and visual clarity of BI outputs. Additionally, I maintain technical documentation, adhere to data governance and change management protocols, and provided recommendations for process improvements and enhancements to BI systems.
I supported the development and delivery of data-driven solutions for clients across industries. The role involves designing, building, and maintaining BI platforms (dashboards, data models, ETL/ELT pipelines) that translate operational and business data into actionable insights. I work with internal teams and clients to understand business needs, ensure data integrity, and deliver visualizations and reporting that drive decision-making.
I was responsible for analyzing business and financial data to support data-driven decision-making. The role involves collecting, cleaning, and interpreting data from lending and customer systems, creating dashboards and performance reports, and providing insights on credit, sales, and operational performance. I ensured data accuracy, tracks key business metrics, and delivers actionable recommendations that help improve loan portfolio quality, customer acquisition, and overall business efficiency.
As a Sales Support Analyst, I analyzed and validated sales data, developed automated Power BI reports, and provided insights to support management decisions. I streamlined data processes using SQL, collaborated with finance and operations teams, and enhanced visibility into sales performance and key business metrics.




Analyzed revenue shifts, sales volume, and customer engagement across product categories over a 12-month cycle using an Azure-hosted SQL database — surfacing trends that informed category strategy.
Read More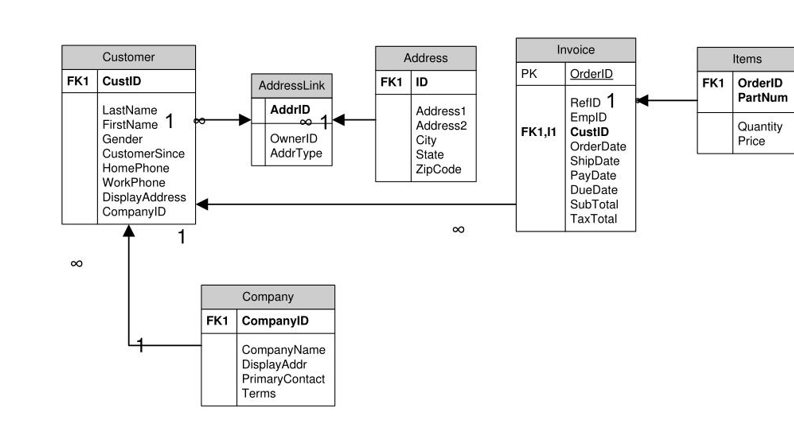
Designed and implemented a transactional data model to support a Canadian bank’s customer acquisition promotion, enabling reliable tracking of campaign performance from first touch to conversion.

Built a comprehensive Power BI dashboard to evaluate CRM-driven sales performance in 2023 — comparing products, reps, and pipelines to highlight where deals were won and lost.
Read More
Developed a real-time dashboard to monitor operator performance across shifts, tracking efficiency rate, downtime, and actual work time to flag bottlenecks and drive productivity improvements.
Read More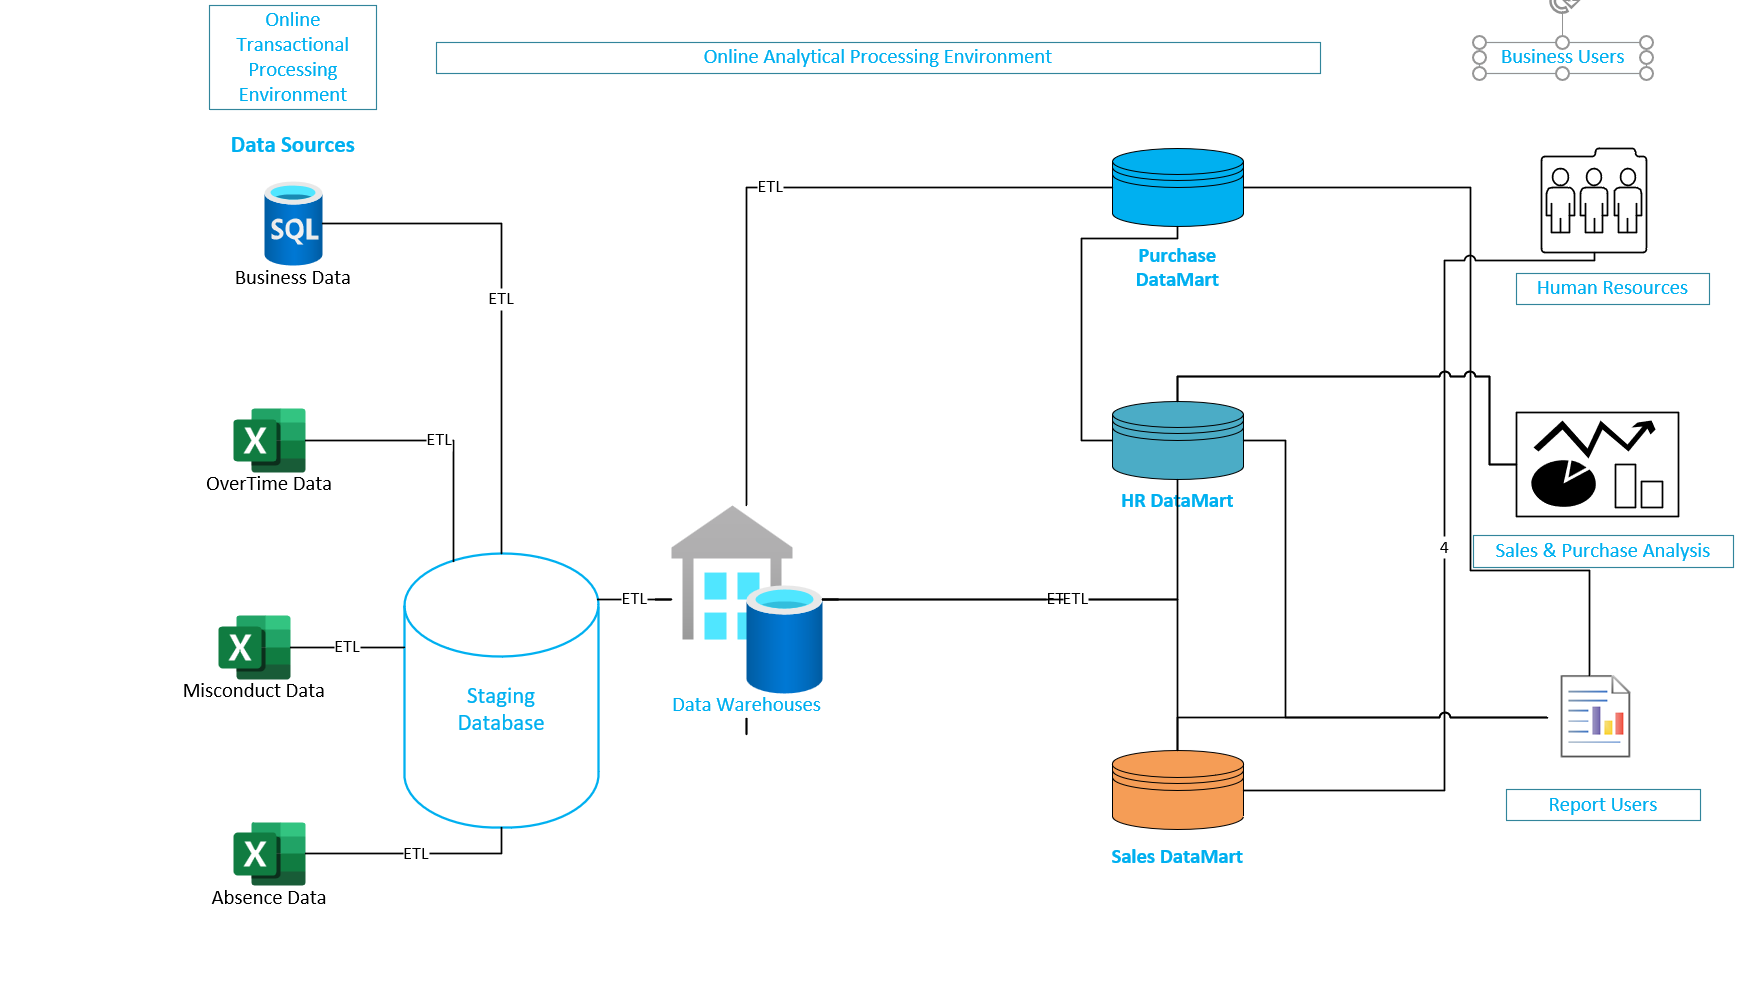
Consolidated data from multiple disparate systems into a unified analytical platform — replacing siloed reporting with consistent, governed insights accessible across business units.
Read More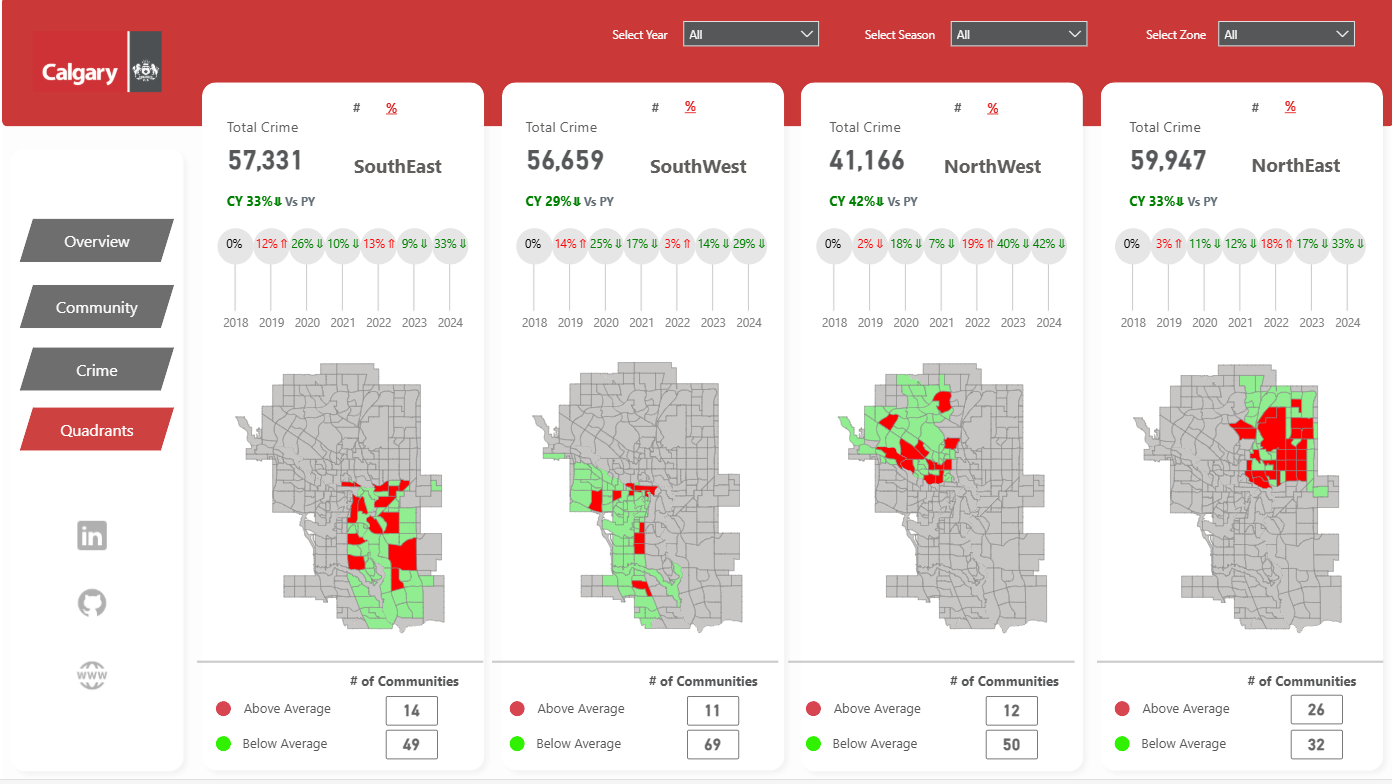
Mapped crime intensity, seasonal trends, and category distribution across Calgary communities — turning open civic data into a visual safety intelligence tool.
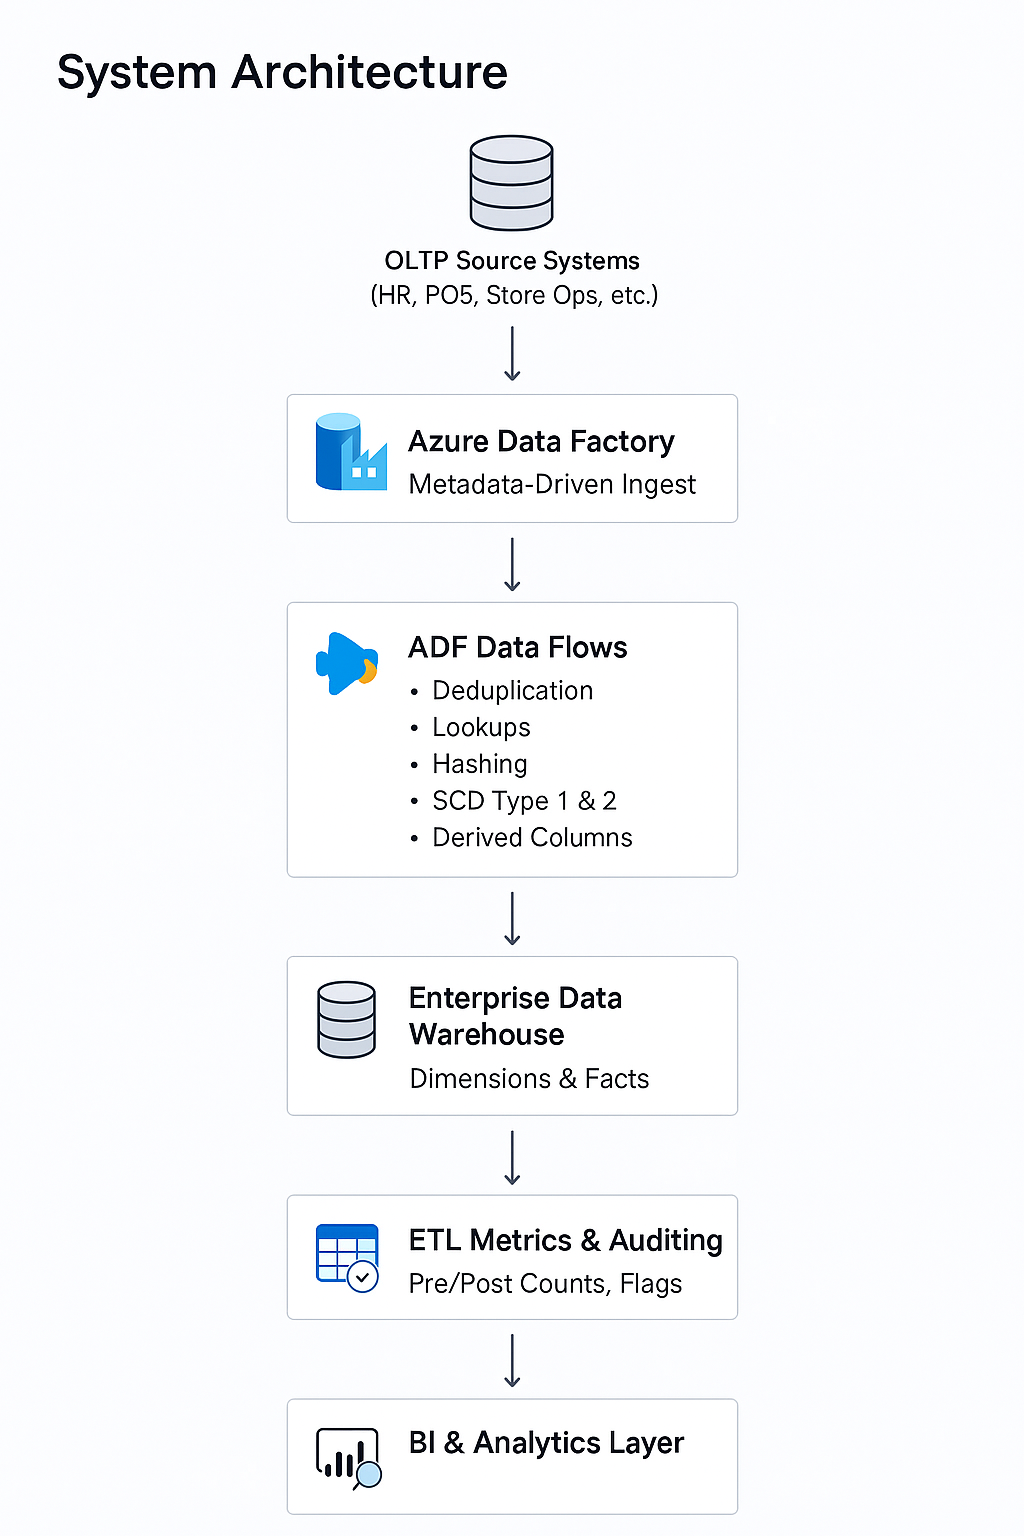
Built an Azure Data Factory ETL framework that consolidates OLTP data into an analytics-ready warehouse, with incremental loading, SCD handling, deduplication, and full audit logging.
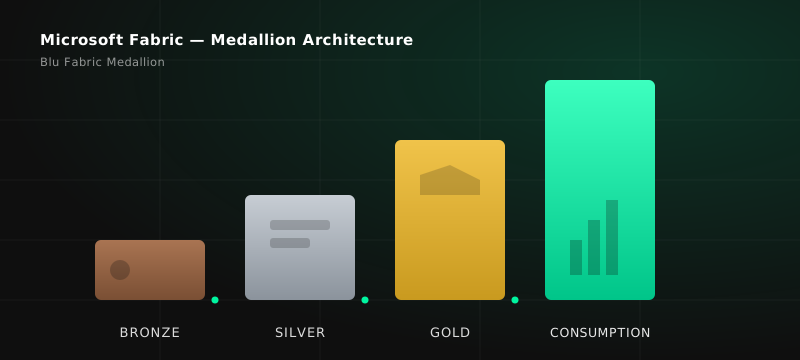
Built a full Bronze/Silver/Gold/Consumption Medallion architecture in Microsoft Fabric for a fictional 830-store grocery chain, working with an AI coding agent with every architectural decision reviewed — plus a nightly pipeline that runs itself.
Read More